This is a beta environment that serves to nurture interoperability and workflow FHIR ®
discussions (who, what, when, where, why, how, current state/status, & endpoint(s) monitoring)
To Begin >Left click or to select an icon, an image will appear on left mid-edge of Blue Surface, begin by dragging this icon to corresponding processing area.
Double clicking on cloned icon, will image
Clicking on the Grey Areas will show the Level of Processing and Communication Layer
Reference URL Links to Resources will appear in Yellow Box as you scroll down each icon
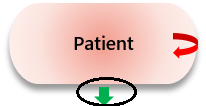
Red arrows designate as internal error processing routines,
Green arrows designate as normal processing routines
Using Microsoft Edge on Surface Studio
will assist with Markup Notes and Communication during discussions
05.11.2016 Notes (does not contain all possible resources on selector) Under Tools > Changing Color Icons (aim to represent live source system state changes and endpoints) allow & your own entry
08.21.16> Network Typology Map
09.19.16> Patient Resource Data Viewer + Pat Consent Simulation across Servers
10.20.16>Load Custom Workflow
11.06.16>Immunization Module
01.01.17> Patient Search across Test Servers
01.15.17> Updated Resources to FHIR ® STU3 Version 1.8.0
02.05.17> Encounter Resource Data Viewer
02.14.17> Integrated Profiles for Server 1 Patient Resource with
02.19.17> MedicationDispense Resource Data Viewer CII alert simulation
03.02.17> ePrescribe Template > Status PieChart Breakdown & Data Viewer + MedicationRequest & MedicationDispense Search + Link correlation Medication Reconciliation simulation across 3 servers
+ID photo for Patient Profiles (integrated examples) + skype simulation
04.15.17> Under Patient Search> Simulation for Same Patient Validation
Patient Profiles> Click on Patient Photo to see Facial Analysis Simulation (MS Cognitive Services)
04.17.17> MedicationRequest + MedicationDispense allow status selection on Icon
05.19.17> Patient Resource Server 1 & 2
Simulate Patient Photo Capture Capability via Https (Edge requires camera device setup & allow http)
06.08.17> Added Practitioner Search and Data Viewer + LinkedIn + NPI reference
06.11.17> Added BingMaps
+ Building Levels & Device Locations
+ Workflow Identification on Level (Select Map > Select Location3 on Map (show building levels) >Select device details > Select depiction of associated workflows or
for Re-route simulation
06.28.17> Added BingMaps Organization Simulation with Random Health Service Facility TestData
Accountable Care Organization Network Simulation-Health Service Facilities (Hospitals/Clinics/Pharmacies/Dental/Housing) overlay with 2010 Population Census by County.
07.01.17> Added BingMaps Health Service Facilites with Real Data
Sources from HRSA 06.2017 + Bing Query Entity IDs 8060 (hospitals) + 9565 (pharmacies) with 2010 Census Overlay + Calculate Highlight Area Radius capabilities +
* 2010 Census Data not available for all Counties..
07.27.17>Added 3D
simulation with Snomed link to Substance selector
07.30.17 >Added for Observation +
for ImagingManifest
08.20.17> Updated Heathcare Service Locations SNF locations features onclick+
+ ( Source)
08.26.17>Added Coverage Insurance Plans
Please ensure a location is submitted through Bing Search Box to enable state & county validation before . Access to Map is also on the Coverage Resource Icon under the Financial Category
09.09.17>Updated Selector Icons and references for new resources
10.09.17> New allows for drawing a circle to capture+print health service facility listing info
 .
Press Logo will initiate Draw + clear existing search area.
Added BingMaps >+ > +
10.15.17> Updated + Measure Resource prototyping +
10.27.17>Added State Transitions , 11.05.17 Updated
11.10.17>Can draw arrows  by dragging green arrow after cloning
11.16.17>Added Tilt Design Surface ability+ expanded clone draggable area beyond blue area
11.17.17>Added ability to show arrow connector layer on top of animation layer
11.28.17>Updated State Transition values : FHIR© + Azure Logic Apps© + Sharepoint © + WCF© Workflow states
12.03.17>Added Azure Icons on Selector  + Task Resource Workflow Overview
12.05.17 > Added Azure deployment configuration prototypes for reference
Accessible on the Workflow Templates > FHIR Task Workflow
12.11.17 > Added Cisco deployment configuration prototypes for monitoring remote devices connecting to on premise server networks
03.11.18> Updated added sources from Census, BEA 2017Q4, AHRQ -MEPS for demographics/economics/disparity analysis with transparency adjustable overlay capabilities +
added Research Study State/Workflow & References
05.07.18> Updated SAMHSA - OTP locations .
05.09.18> Updating BRIDG V4.1 to V5.1 reference, FHIR resources V3.01 to V3.30
06.24.18> Updated Modeling Patient Flow for Admissions and Discharges to simulate 90 day bundle care among multiple services with counts on patients and providers involved along with costs and linking to FHIR resources:patient, provider, claims + detailed process simulation within each flow
07.29.18> Updated Modeling Patient Flow withCMS Assessment Data Element Reference for Home Health, LTC, SNF, Hospice, IRF
08.20.18> Updated Modeling Patient Flow with DEL Assessment Data Element Reference with json definitions SNF,
LTC,
Home Health,
Inpatient Rehab
08.21.18> Updated BRIDG 5.1 reference to BRIDG 5.2
09.30.18> Added Templates for Clinical Trials Protocols from
Added reference to Sentinel Initiative and Common Data Model under Measure Report
11.17.18 > Added Provider Taxonomy, Role and Relationships Explored - to facilitate RBAC analysis + in workflow templates
11.18.18 > Updated FHIR resource references V3.3.0 to V3.5.0
03.06.19> New 3D Community Network Simulation
06.02.19> Updated 3D Provider Taxonomy Relationships 
06.06.19 > Updated FHIR resource references V3.5.0 to V4.0.0
06.09.19> Updated 3D Provider Taxonomy Relationships  with FHIR V4.0.0 DDL & hover for element descriptions & 🤸sorting & some enum valid values.
06.22.19> Updated  FHIR V4.0.0 > Resource Drilldown to reference objects and codeableconcept values
06.30.19> FHIR V4 Data Dictionary Table with 🔍 & Microsoft Translate into multiple languages
09.11.19> New Demo on the "Value" of FHIR in upcoming Value Based Care Models 💵
09.17.19> A Timeline Prototype using Google Timeline Charts with SytheticMass - different visual experience and interaction with data ⏲️
09.18.19> Added NIH references > PubMed, RxNav, DailyMed to "Value" of FHIR demo
09.22.19>Updated version ⏲️
09.29.19>Updated version with NLM, FDA, NASEM, AHRQ references to coding price/cost, adverse events (drugs,devices,enforcements) etc.. + embeded Timeline on each profile "Value" of FHIR demo
10.21.19>Updated "Value of FHIR demo" with Graphs for EOB and Claims Analysis + Observations/Lab Values Plots + Resource Utilization PieChart that syncs summary, timeline & graph for each profile📈
10.31.19>Updated "Value of FHIR demo" with abiltiy to retrieve claims with no corresponding EOB response + added claim url ref
11.05.19>Updated "Value of FHIR demo" on EOB Resources to retrieve previously missing Encounter ID and the consolidated Claims info based on claims url reference
11.13.19> Simulate Checked Items data transfer to Clinical Notes (legacy systems) + MS Teams private channel
11.28.19> Updated "Value of FHIR demo" on Server 3 ( Click on Patient Icon > > Server 3)
01.15.20> Updated "Value of FHIR demo" on Server 3 ( Click on Patient Icon > > Server 3> ) > fixed url ref of Claim ID + interface to MS Teams prototype success. 🙇
02.01.20>Updated version ⏲️
02.05.20>Updated version ⏲️click on the 2nd to show all the chartable lab observation, hovering over the timeline will sync up the individual charts. all the charts are draggable.
02.10.20>Updated version New Stacked Graphs with color - works with 2nd Panel on point selection - access these on top of tooltip button 2 and 3
03.13.20> New version New Tables for calculations on Crcl, ABW, IBW [last button on right side vertical - Lab observations]. + all events on hovered entry date (vertical) and category.(horizontal)[first top button from right- on all categories ]+ Heart Rate Monitor - Azure IOT remote simulation [first top button from left - Lab observations]
03.26.20> New version with Claims&EOB tables+ Encounter Events : added provider Name + org Name + Care Plan Goals +and new hover features will pull up labs+ fda medical device reference for Azure IoT Hub integration
04.03.20> New simulation with Map, Skype (Telehealth), Use Case/Prospects for remote vital signs monitoring using Azure Edge Zones (5G) leverage + remote staff guidance systems using Hololens 2, and new references to NIST and OCR (04.02.20) Notice of Enforcement Discretion of Business Associates
04.03.20>New version with updated Map resources pointing to county level data (for grant applications)
New Contact Tracing prototype 1 
07.23.20>New ability to save and retrieve the objects placed on design surface under the
07.26.20> New SFO map poc census tract covid case count correlation with CDC/ASTDR Social Vulnerability Index Geoloc Map SFO+ for SVI Layer for all of US region with Language + Technology Density Tract Level data from Census ACS14_18 🗺️
11.19.20>Population Health Prototype with census, svi, and synthetic mass data 🗺️
11.30.20>Updated Population Health Prototype Simulation with census, svi, synthetic mass, pharmacy loc data + SNF population at county + zipCode layer 🗺️
Updated US healthservice_hsl102717 map with (phcy locs:walgreens+cvs only) census, svi + SNF population at county + zipCode layer with "missing SNF Info indicator" for vaccine dose estimates🗺️
01.03.21 NIST SP 800-53r5 security & privacy & ISO crosswalk tool 📒
03.02.21 NIST SP 800-53r5 security & privacy & ISO crosswalk tool 📒 with control id map references to sp800-160v2 (cyber resiliency techniques), NERC CIP v5 (critical intrastructure protection), sp 1108 r4 (smart grid interop) , sp 800-207 (zta), sp800-53B (baseline control profiles)
03.16.21 added compiled sp 800-53r5 control id matrix to external reference from base line controls to [privacy framework, hipaa, zta, tech resilency ]
03.31.21 + tags[mini links] + control maxtrix [sortable|multiple baseline select] + FHIR data dictionary sync with main security+privacy control descriptions + FHIR Object Implementation Prototype >🔎reference links to nist 8112 attribute doc / ION blockchain / Azure Verifiable Credentials / W3.org VC Schema +🤹 more
06.07.21 SVI 3D 🗺️ attempts to correlate 2018 CDC SVI themes with 2019 ACS5 Census data in 3 dimensional maps + ASPEP + CBP data for infrastructure, resource and personnel requirements/estimates.
07.18.21 New Map with CDC BRFSS :Behavior Risk Factor Surveillance System by Census Tract and County presented in Graphs for past 5 surveys 2015-2020 releases (attempted to crossRef/validate on county level 2018 CMS FFS >65yo data on brfss:corem & corew observations) + search functionality for HealthyPeople 2020 & HealthPeople 2030 measures for baseline and target numbers to address brfss observations within each community + dynamic search queries to multiple agencies (Census, AHRQ, PubMed, MedlinePlus, CMS,BEA ,FRED etc) to support additional research to promote reaching HealthyPeople2030 targets
08.09.21 updated above 🗺️ with census ACS5 2019 graphs on tract level measures on status for :vision, ambulatory, living independent living, >65 living situation, cognitive, disability, hearing, self-care
08.20.21 updated updatedCensus Community Resilience Release 08.10.21 and California ER and Primary Care clinics (subset) for validating/xRef BRFSS findings
10.10.21 new >📈 environment scan on chronic conditions [comorbidity] correlation,risk assessment factors (hcc raf), utilization, different price index definitions and prevalence [BEA-MEPS, BLS, CMS-CCW, CMS-RAF] . This also attempts to crossRef BRFSS findings with CMS CCW data.
11.30.21 updatedCCW Conditions Count breakdown for State, County, National + CDC community level transmission data on county level graphs
12.24.21 updatedUpdated with Zip level >Prescriber' perspectives on beneficiary risk level, prescriber medication utilization (graphs with beneficiary counts, total cost, claim counts) , each drug is linked to FDA resources: drug shortage db, recalls, adverse events, + CMS partD, partB, medicaid utilization trends + explore MS Teams, Dynamics, Power Automate, Flow and FHIR integration to enable supply chain resilience
01.09.22 updatedUpdated with manufacturer level integrated FDA ndc data + CMS National partD, partB, medicaid utilization/cost data and 📈 with cms manufacturer "overall" RX category level analysis
02.02.22☞updated📈 + va therapeutic class perspectives 📇 to drugs + pie charts link drug market share [zip code]+ rems drugs found within that zip + fda unii substance refs + case simulation on ranitidine recall (by fda 04.20) to analyze current workflow and data gaps..
03.03.22 🆕 CDC wasterwater surveillance / monitoring 15day period (data frequency = daily), layered on community transmission data [county level]
08.30.22 🆕 mmwr charts 2020, 2021, 2022 present week with datasets from cdc - medicare - medicaid data crosss ref by week, month, qtr, year
12.12.22 🎄updated 🗺 to link 2022 zip code level medicare 💊 formulary to identify participating contracts and plans available for medications identifed by 2019 medicare prescribing trends [zip code level], and concurrent checks for medicaid rebate eligibity, nadac pricing and past 3yrs of national [not zip code level] medicaid utilization trends, it attempts to calculate Δ reimbursement and acquistion /unit and average reimbursement per prescription; data is further broken down by categories of managed care or fee for service segments against time variable of quarters and charted against monthly survey of nadac acquistion cost for correlation. Additional features include compiled notes and src reference that can be copied to MS Teams and a QR code label to the fda source on the package label for DSCSA implementaton and concept test on supply chain tracing from manufacturer to final entry on claim. Additional objectives include providing estimates on dcsca and cms interoperability + patient access implemenation + infrastructure requirements
Acces to module
> select zip code on map
> ℞
> Drug Table (select drug: Lisinopril)> C
>Lisinopril 10mg click this>NDC> this will then create table and charts
> click on the drug Lisinopril 10mg > will check within this zipCode to see if any 2022 contracts +plans [ prior auth requirements] provide coverage to this drug.
> Lisinopril 10mg click this>SBD will check for Brand Name ndcs associated with drug along with contracts and plans that offer coverage
> to see additional medicaid calculations click the +/- column located on top of table
09.10.23 🆕+drug adverse events module [next to recalls icon] after selecting a drug from Gnrc_Name table, goals were to examine data requirements between fhir, currrent fda api, and ICH spec, + look at the data volumn, velocity, integrity, data types, limitations, and data gaps with the fda api. [this module is resource intense].
since we could not subset [medicinalproduct+drugcharacterization] directly from api, we built a search function so 1=suspect,2=concomit,3=interact is associated with the drug ie search > 1)lisinopril for suspect.
Inaddition there are multiple filters via piecharts and sankey diagrams that can control the table views, which hopefully will provide some scope/insight on data being captured
we also updated the rxnorm tty= SCD pointer from [12] to [13] >api reference call 'https://rxnav.nlm.nih.gov/REST/Prescribe/rxcui/'+rxcui+'/allrelated.json'
07.21.24 🆕 updates from 2019 to 2022 Part D 💊 utilization data [ geolevel= zip, freq= YR ] (src)- reflected in provider trends ℞ and therapeutic class 📇
drug item level ndc data is from medicaid (src) and contains nadac + latest 2023Q1-Q4 release medicaid 💊 utilization ffs+mcou data [ geolevel=state, freq=QTR ]
11.25.24 🦃 🆕 CMS Dataset Catalog
05.19.25 New Map 🗺️

